

Climate Corner
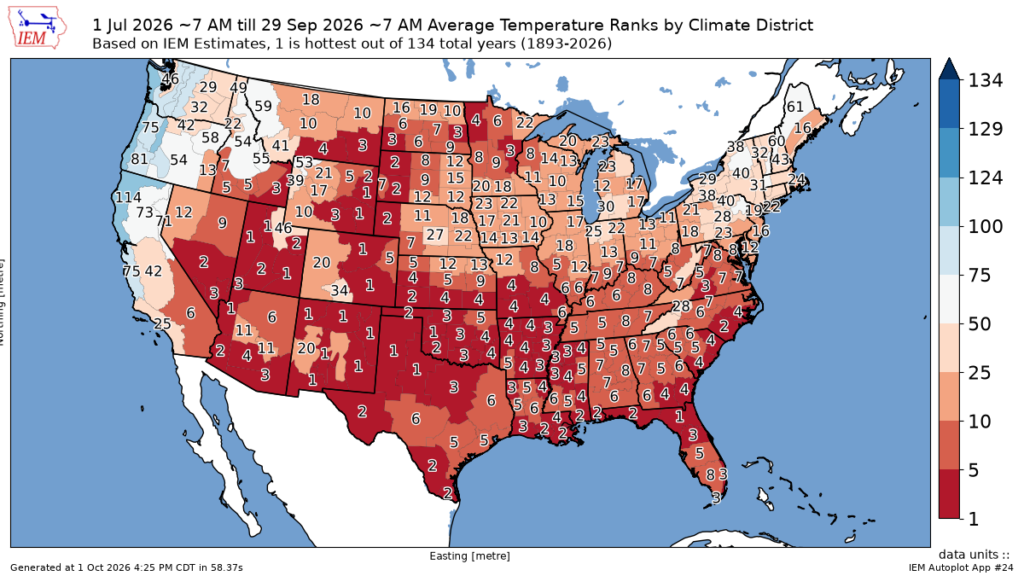
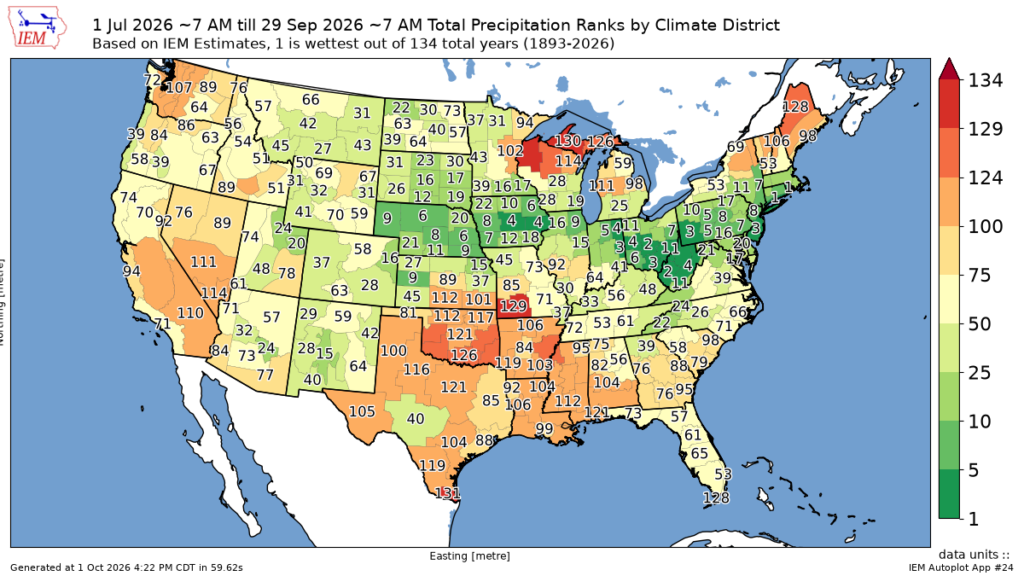
See how the past 90 days compounded from a temperature and precipitation standpoint by climate district.
How to read these maps: 134 years of climatological records are logged since 1893.
A rank of 1 = warmest since 1893 while a rank of 134 would be the coldest since 1893. For precipitation, 1 = wettest while 134 = driest.
Past 90 Day Temperature Ranks by District
Past 90 Day Precipitation Ranks by District
Past 90 Day Aridity Index
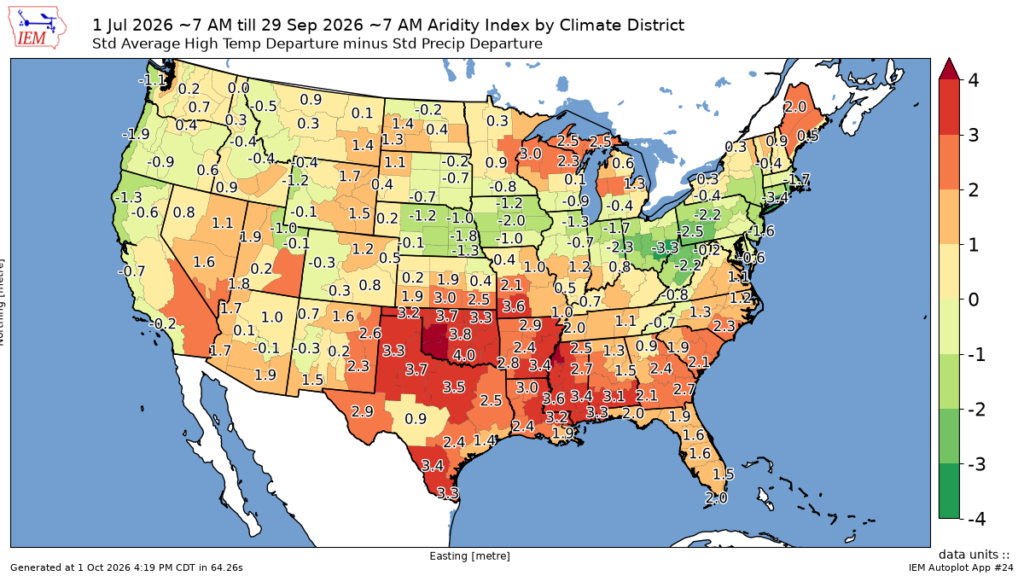
How to read this map: The aridity index is a measure of water stress utilizing temperature and precipitation data. It is a useful drought monitoring tool.
Positive values indicate water stress or drought prone areas.
Negative values indicate lower water stress generally coupled with cooler and wetter conditions.
* More information on the current drought status from the NDMC and NOAA here